A big thank you to all those who completed the survey, we had 519 respondents. 75% of people said they had visited Putney that day or within the previous week meaning their knowledge of the town centre was very current. 82% visited between 8am and 4pm, 16% between 4pm and midnight and 2% before 8am.
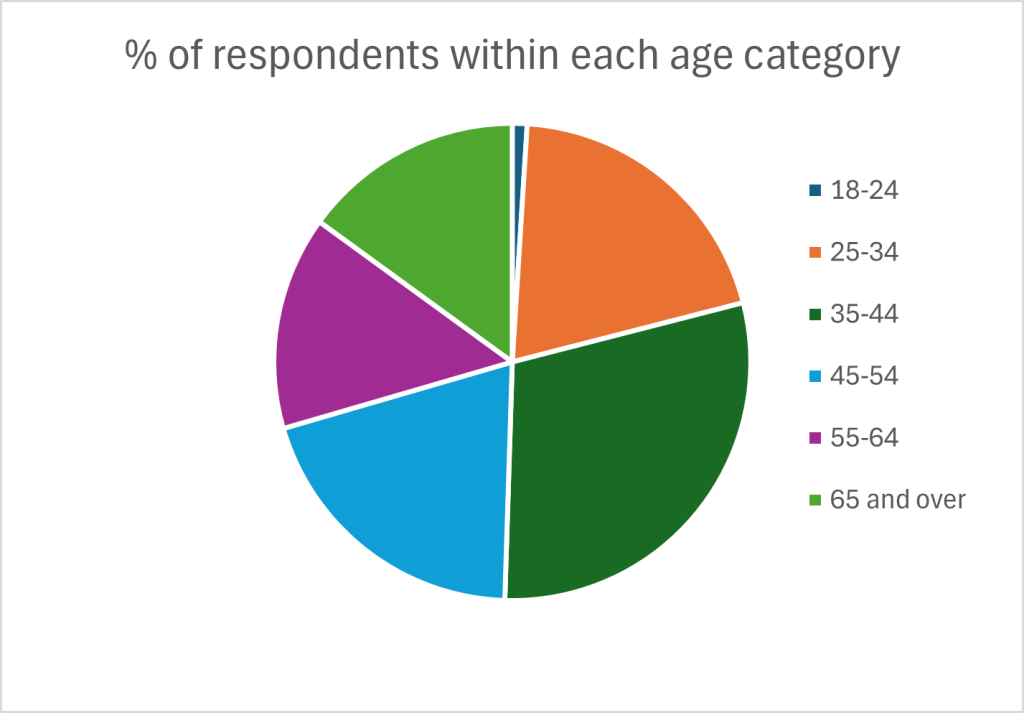
88% live in the SW15 postcode, 5% SW18 and the final 7% from a variety of postcodes. 29.5% are aged within the 35-44 category, 20% 45-54 and 20% 25 -34. 14.5% 55-64, and 15% over 65. Just 1% between 18 and 24 years, and noone under 18 completed the survey.
75% of people walked to Putney, 8% by car and 8% by bus. 2.5% by own bicycle, 2% by train, 2% by tube and 1% by hire bicycle. The remaining 1.5% (7 people) added a note as they used a combination of transport methods.
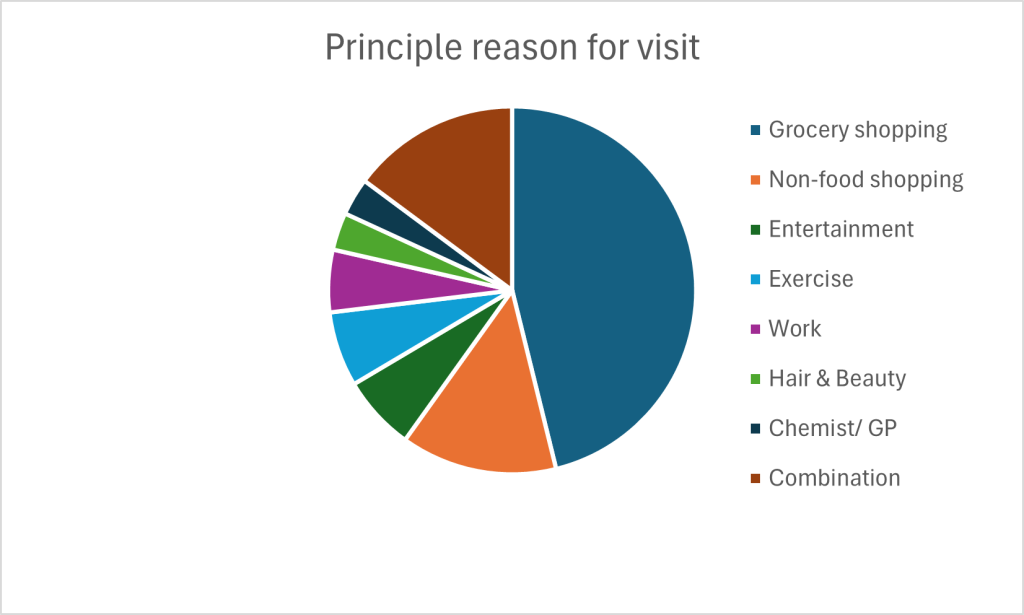
42% said the main reason for visiting was to do grocery shopping, 12.5% for non-food shopping, 6% for entertainment, 6% for exercise, 5% for work, 3% for hair and beauty, 3% for chemist or Doctor and 13.5% a combination of them all.
64% said the offer of businesses in Putney town centre was excellent, good or average. 36% said offer was below average or poor.
Unsurprisingly, considering the majority answer to the main reason for visiting, the most important type of business was supermarkets. This was closely followed by independent businesses and then hospitality businesses.
We had 471 responses to favourite business with lots mentioned multiple times (sometimes with different spellings). It seems Dugard & Daughters, the new delicatessen and butchers is proving very popular.

A range of answers given to the percentage of your weekly shopping spent in store (versus online). With 501 responses the average amount was 51% spent in store, and 49% online.
The household frequency of use of food delivery apps such as Deliveroo, Uber eats and Just Eats was 48% less than once a month with the remainder being more frequently. 30% said they use them once a week.
The most important aspect of Putney that needs solving is traffic, with 210 people stating that as their highest priority. 99 people put filling empty units as their highest priority and 146 put filling empty units as their second priority. The other 5 categories all had fairly equal percentages ranking them from 3 to 7. The least priority with 252 in 8th position was improving night time safety. A surprising low priority which either means that people feel safe, they don’t go out at night or is just a reflection of those who completed the survey.
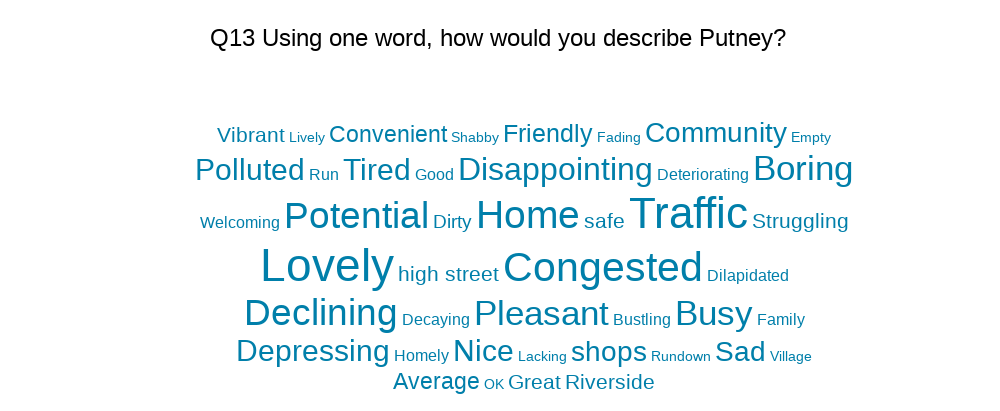
Using one word to describe Putney is a combination of negative and positive sentiments – the word ‘Lovely’ was the most common word used, followed by ‘Traffic’, ‘Congested’ and then ‘Home’.
Moving onto Putney’s key strengths, 100 different words were given but with Shops (83 responses), River (51) and Location (43) occurring most often.
The results of this survey provide useful insights into how people use Putney town centre which helps Positively Putney BID plan our work, and with our discussions with businesses. It is very apparent both in this survey and from walking around Putney that traffic continues to be a big issue. We will feed this knowledge back to Wandsworth Council and Transport for London who manage the highways and traffic.